Just now I´m sitting with some laborations in Silverlight and found myself unable to debug my code just because it triggered the “hosting” webpage in Firefox instead of Internet Explorer. I got the following message:
The breakpoint will not currently be hit. No symbols have been loaded for this document.
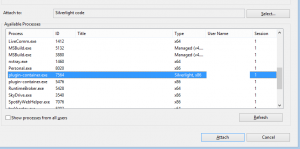
This isn´t so wierd since Visual Studio cannot guess what process is currently holding your Silverlight session. What you need to do now is to open the attach tool manually and select your process. The tool is found under Tools->Attach to process (or Ctrl+Alt+P). I can´t guarantee this is true for all sessions but for me the actual Silverlight session was hosted in another process outside firefox, namely a “plugin-container”, you can find this by looking at the type “Silverlight, x86” in this case. Select, attach and you´re good to go!

