High test coverage is essential to safe refactoring and to ensure high test coverage you need to either work using TDD or make sure your coverage doesn’t drop. How will you make sure coverage doesn’t drop if you don’t know what it is? Here’s my take on how I ensure a reasonable flutter test coverage in my projects.
Test coverage in flutter
Adding in coverage reporting to your flutter project is dead simple. It takes one more parameter in your test command:
flutter test --coverageThis will generate a file called info.lcov in the default folder named coverage.
Generating an HTML coverage report from lcov
Next up, you might want to actually look into how your coverage looks. To do this, use genhtml to give yourself a nice HTML report. It’s a shell one-liner:
genhtml coverage/lcov.info --output coverage/The report you get looks something like this below:
For a live example, check out the coverage report I’ve got for my free currency conversion app TravelRates.
Getting the coverage report in Gitlab CI
Exactly the same way as you do when generating it locally, I use an existing flutter image in my Gitlab ci file and it contains both lcov and genhtml used above. The Gitlab script is as simple as this (or see the full gitlab-ci.yml):
unit_test:
  except:
    - master
  image: cirrusci/flutter
  stage: test
  script:
    - flutter test --coverage
    - lcov --list coverage/lcov.info
    - genhtml coverage/lcov.info --output=coverage
  artifacts:
    paths:
      - coverage
This will generate the HTML report and output it to the Gitlab pages root folder, like the example coverage report for TravelRates. However, it won’t show up where you would like to have it, in the Merge Request.
Displaying test coverage in Gitlab merge request
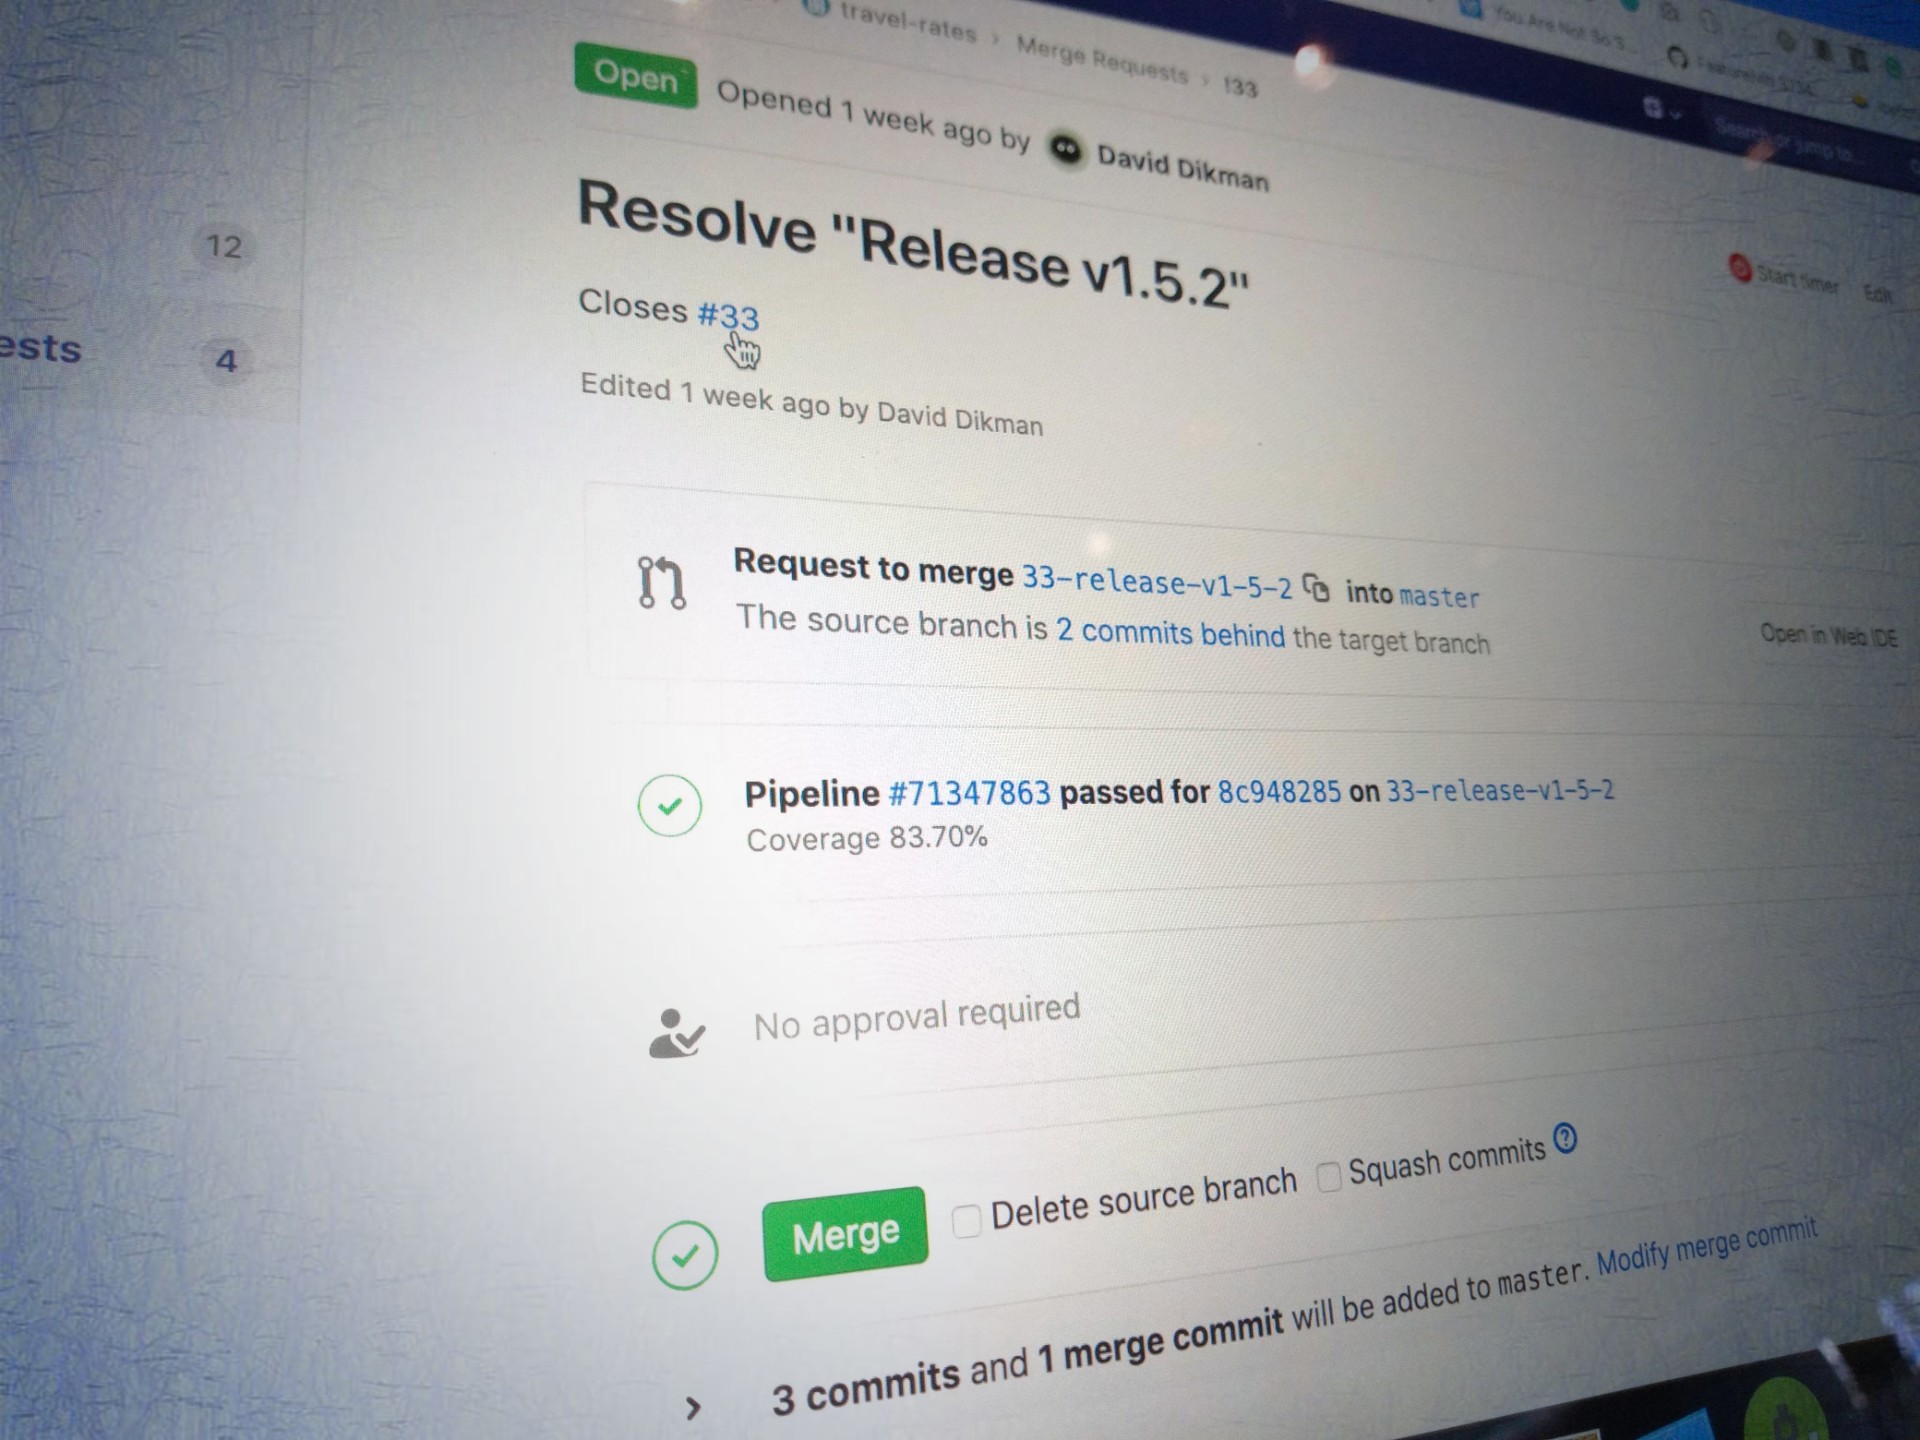
Gitlab CI has specific support for displaying coverage. It comes up as a single line on the merge request and looks like this:

Showing test coverage in Gitlab merge request
The coverage is extracted by running a regular expression on the log output from the build job. If you are generating an HTML report the coverage is also reported on the output from this script:
Reading data file coverage/lcov.info
Resolved relative source file path "lib/ruby_document.dart" with CWD to "/Users/ddikman/code/japanese_reading/lib/ruby_document.dart".
Found 8 entries.
Found common filename prefix "/Users/ddikman/code/japanese_reading"
Writing .css and .png files.
Generating output.
Processing file lib/loader.dart
Processing file lib/ruby_parser.dart
Processing file lib/scraper.dart
Processing file lib/main.dart
Processing file lib/ruby_document.dart
Processing file lib/article_page.dart
Processing file lib/text_with_readings.dart
Processing file lib/news_article.dart
Writing directory view page.
Overall coverage rate:
  lines......: 65.5% (203 of 310 lines)
  functions..: no data found
Using the following regular expression we can get the coverage from this:
s*lines.*:s*([d.]+%)However, if you’re not running the genhtml you can just as easily get the coverage using the lcov tool:
lcov --summary coverage/lcov.info
Reading tracefile coverage/lcov.info
Summary coverage rate:
  lines......: 65.5% (203 of 310 lines)
  functions..: no data found
  branches...: no data found
Gitlab won’t automatically pick up this value as it could come in any shape or form so you’ll need to configure this.
It is really simple though, add one more line with the coverage setting to your gitlab-ci file:
unit_test:
  except:
    - master
  image: cirrusci/flutter
  stage: test
  script:
    - flutter test --coverage
    - lcov --list coverage/lcov.info
    - genhtml coverage/lcov.info --output=coverage
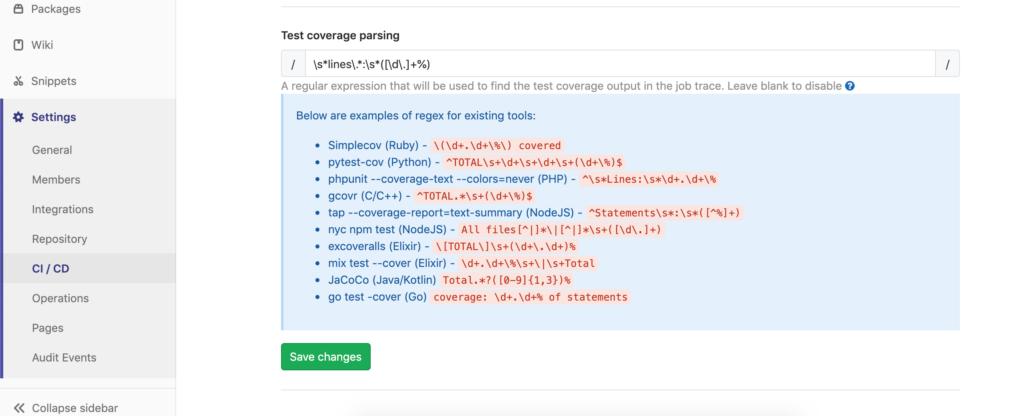
  coverage: '/s*lines.*:s*([d.]+%)/'
  artifacts:
    paths:
      - coverage
Note though that when adding the regular expression, you have to add it as a regular expression string with the starting and adding slashes.
Update 2023-01-17:
Previously, Gitlab CI had a settings area under Settings > CI/CD > General Pipelines > Test coverage parsing where you could add this regular expression. This is now retired and instead, you need to add it to the .gitlab-ci.yml file.

How the regular expression was previously configured in Gitlab CI
You can find more information on configuring the test coverage parsing in the official documentation.
Use coverage correctly
I’ve found tracking coverage really useful in the past, it helps me ensure that I don’t slack off and do testing properly. That being said, a nice 100% coverage doesn’t actually mean you cover everything. I’ve seen (and written myself) code that has nice coverage but when you start picking it apart, it turns out that even though the lines are hit the correct or full functionality isn’t actually being tested. Consider this for example:
foreach (var item in list) {
  if (item.name.startsWith('doCode') {
    service.doCode(item);
  }
}
A test with one entry in here will hit all lines, however, if we’ve mocked the service or there are new items in there that should have different behaviour, well, we’ve got 100% coverage but the code might not actually behave the way we want. So before I leave you, I want to highlight that code coverage is great, it’s a really useful metric but as with all metrics, it’s just a number. Use it as a tool, not as the truth.
Going forward I’d like to use TDD more and see what happens with the coverage as I believe TDD should drive up towards 100% coverage or at least make sure that everything you want to be covered is covered so maybe it renders looking at the coverage pointless. What do you think? I’d love to hear your thoughts in the comments!
